Computational model of political corruption networks
Interact with realistic simulations of corruption networks
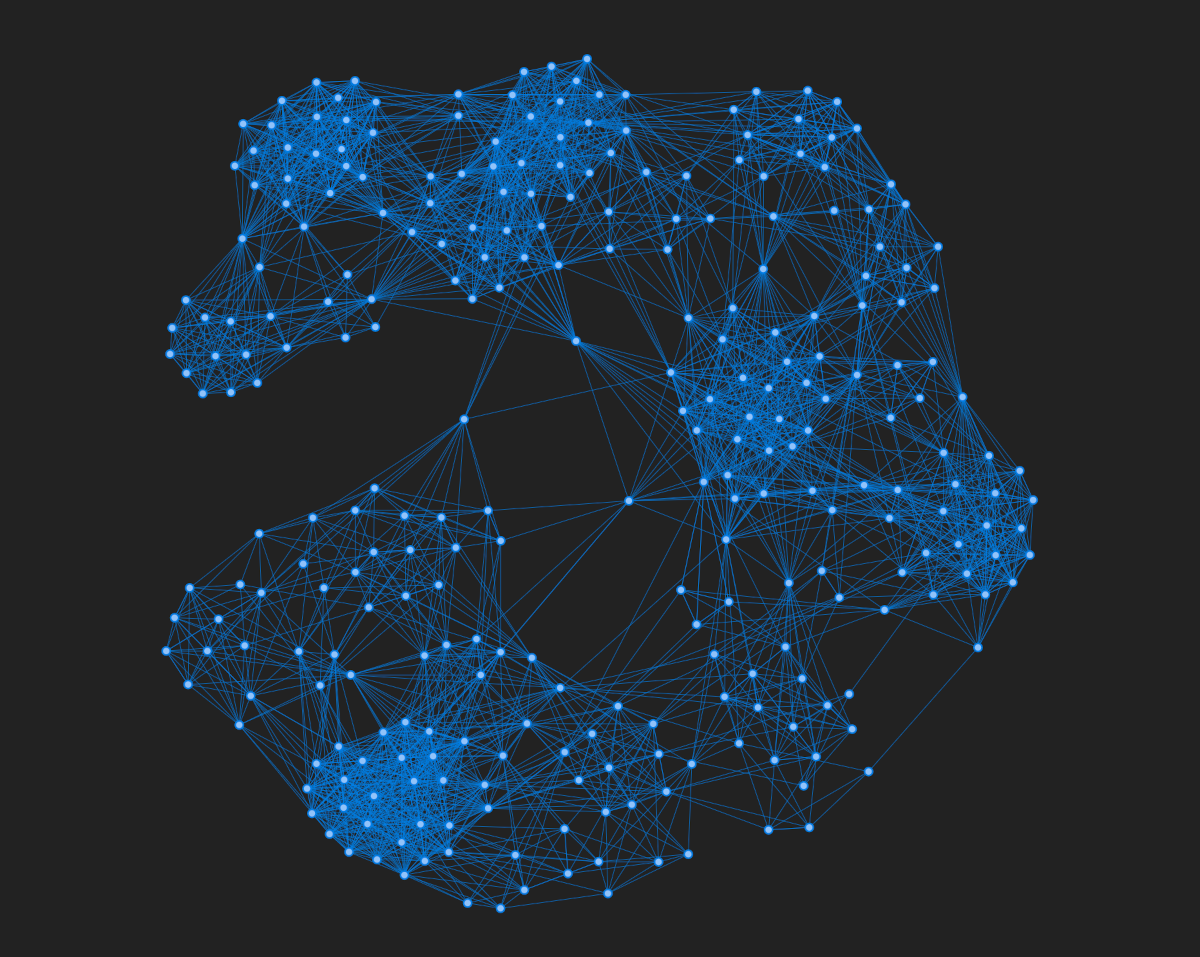 A network simulation using the model of political corruption networks.
In our latest paper, the findings of universal characteristics in political corruption networks allowed us to propose a model to simulate the growth of corruption networks. Among other results, our research revealed the prominent role of recidivist agents on corruption networks. For instance, we discover that recidivists act as bridges among minor corrupt groups and coordinate peripheral criminals to perform more extensive and often much more harmful corruption processes.
Motivated by these insights, we have used the recidivism rate (i.e, the fraction of corrupt agents recurring in the criminal activity), as the main parameter of the model. The simulations not only produce networks with features very similar to those observed in the empirical data, but also indicates that corruption networks operate around a critical recidivism rate. More specifically, corruption networks simulated below this critical recidivism rate are completely fragmented, while networks generated above this critical value become overly connected.
In this post, I will
- Describe the model
- Display an interactive demonstration
- Present the algorithm of the model in Python
The model
We have proposed the model based on two of our main findings about political corruption networks. In particular, we have found that the size distribution of scandals is roughly approximated by an exponential distribution with a characteristic number of people around seven people. This result shows that political corruption runs in small groups that rarely exceed more than ten people (only 20% and 17% of corruption cases in Spain and Brazil, respectively). The surprising similarity in the size distribution of scandals in both countries suggests a universal pattern related to political corruption processes.
The second finding came from investigating the dynamics of repeat offenders. We have found that the number of recidivist agents is linearly associated with the number of people in the network over the entire network growth process. The recidivism rates (number of repeat offenders divided by the total number of offenders) are 9% for Spain and 14.2% for Brazil. Therefore, the number of recidivists ($r$) can be modeled by the following equation.
$$r(n) = \alpha n + \beta,$$
where $n$ is the total number of people and the parameters are
- $\alpha$: The recidivism rate (number of repeat offenders / total number of offenders). $\in [0, 1]$.
- $\beta$: The regression coefficient. It controls the minimal number of people necessary for the emergence of the first recidivist agents. $\in [-\infty, 0)$.
The model works as follows. It first starts with an empty network that grows by including complete graphs representing political scandals at each iteration. The size of these complete graphs ($s$) is randomly drawn from an exponential distribution ($P$) to mimic the empirical behavior given by $P(s)\sim e^{-s/s_c}$, where $s_c$ represents the characteristic size of corruption scandals (empirically, $s_c\approx 7$ people). We consider that part of the agents added to the network at each iteration are recidivists. We assume the number of recidivists to increase linearly according with the equation of $r(n)$. We keep track of the number of recidivists during the network growth process, and when new recidivists emerge, we randomly select nodes already present in the network to become recidivists and make them belong to the next scandal (complete graph) added to the network.
In addition, when selecting nodes for representing recidivist agents, we can select nodes that were already recidivists with a small probability $p$ or nodes that will become recidivists for the first time with probability $1-p$. This last procedure allows us to control the number of agents involved in more than two corruption scandals and reproduce the empirical behavior (about 2.5% of all agents of both Spanish and Brazilian networks fit this condition).
Interact with the model simulations
The application below allows you to interact with the network’s simulations and see how they evolve as you add new scandals. To play with it, first click in the Start new network button and then add as many scandals as you want using the Add new scandal button. Please note that, initially, only complete graphs will appear. After a while, however, the recidivists will show up and they will connect different parts of the network.
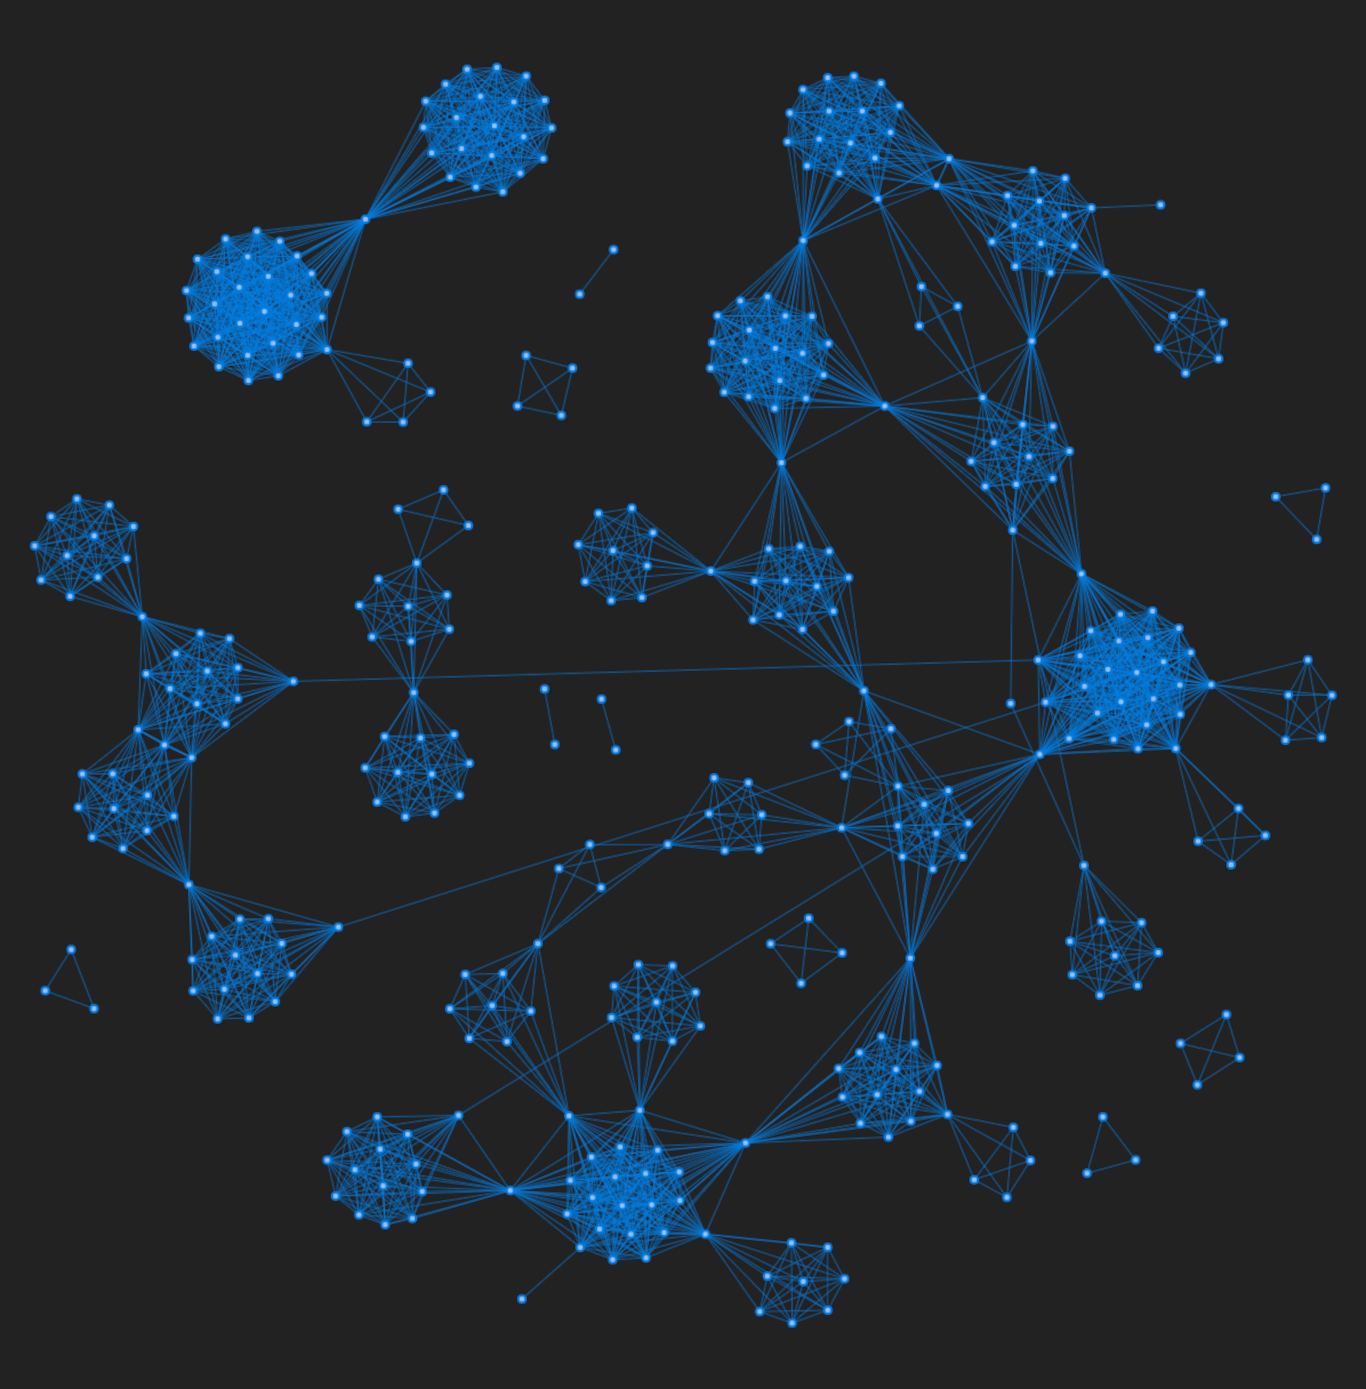
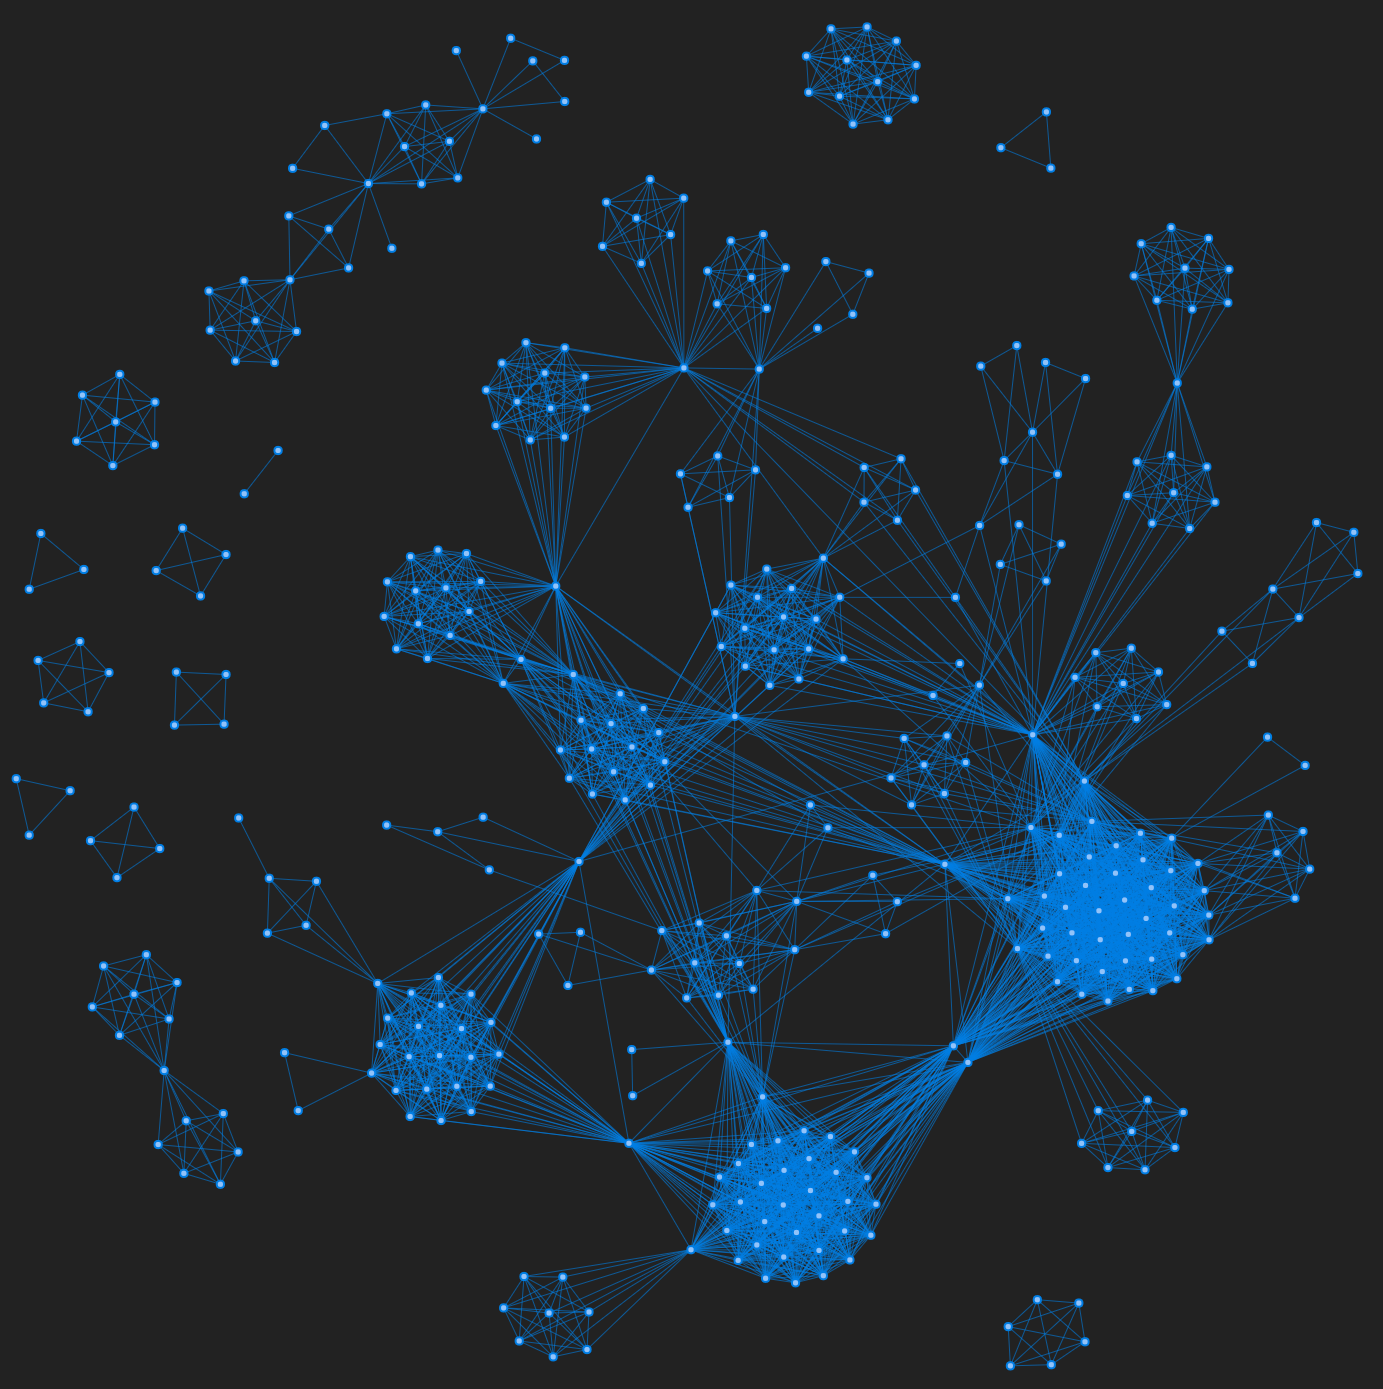
This interactive visualization was made using visjs, a browser based visualization library. The figures below show a visual comparison between simulated and empirical networks. Figure 1 is a simulation of the Brazilian corruption network using its recidivism rate, and Figure 2 shows the empirical network.
For more comparisons (both visual and quantitative) between the model and the empirical networks, see the paper or take a look at my other post where I have summarized our results.
The algorithm
In order to run the model, we first need to import the following packages:
import numpy          as np
import graph_tool.all as gt

from itertools import combinations
The function which generate the network links according to our model is written as follows.
Click to view the code
def generate_net_links(tmax = 100, lambda_ = 7.33, a = 0.09, b = -11.5, proba = 0.024):
    """
    Generate a corruption network based on our model.

    Parameters
    ---------

    tmax : int
           Number of iteration steps (default: 100).
    lambda_ : float
           Characteristic number of people per scandal (default: 7.33).
    a, b : float
           Parameters defining the number of repeated agents (nr) as a function
           of total number of agents (n): nr = a*n + b (default: 0.09, -11.5).
    proba : float
            Probability of selecting a repeated agent that was already involved in
            another scandal (default: 0.024).

    Returns
    -------
    links_list : list
                 A list of edge lists where each element correspond to
                 a particular iteration step.
    """

    t                          = 0
    links                      = []
    links_list                 = []
    agent_names                = set()
    last_agent_index           = 0
    repeated_agent_names       = set()
    total_repeated_agents      = 0

    while t < tmax:
        n_new_agents = int(np.round(np.random.exponential(lambda_)))

        if n_new_agents > 1:

            new_agent_names     = [x for x in np.arange(last_agent_index, last_agent_index + n_new_agents)]
            last_agent_index   += n_new_agents

            new_repeated_agents = int(np.round((a*(len(agent_names)) + b - total_repeated_agents)))

            if new_repeated_agents > 0:
                for i in range(min(new_repeated_agents, len(new_agent_names))):

                    if (np.random.uniform() <= proba) & (len(repeated_agent_names) > 0):
                        #select from repeated_agent_names
                        repeated_agent = np.random.choice(list(repeated_agent_names))
                    else:
                        #select from agent_names
                        repeated_agent = np.random.choice(list(repeated_agent_names^agent_names))
                        total_repeated_agents += 1

                    new_agent_names[i] = repeated_agent
                    repeated_agent_names.add(repeated_agent)

            for agent_ in new_agent_names:
                agent_names.add(agent_)

            new_links = list(combinations(new_agent_names, 2))

            links_list += [new_links]
            t          += 1

    return links_list
This function returns a list of edge lists, where each element correspond to a particular iteration step.
edge_lists = generate_net_links(tmax = 100, a = 0.142) # e.g, [[(0, 1), (0, 3), ... (5, 6)], [(7, 8), (7, 9) ... (14, 15)], ... ]
To create the network until step $t$ we need to concatenate these lists.
def network(t, edges_list):
    g           = gt.Graph(directed = False)
    edge_list_t = np.concatenate(edges_list[:t])

    g.add_edge_list(edge_list_t, hashed = True)

    # Self loops and parallel edges are not allowed.
    gt.remove_self_loops(g)
    gt.remove_parallel_edges(g)

    return g
Now we can generate the network until $t$ steps (100 in this case).
final_network = network(100, edge_lists)
final_network
<Graph object, undirected, with 767 vertices and 4805 edges, at 0x7f2789007d60>
Closing thoughts
The most important aspect of this model is that it highlights the relevance of recidivists in criminal contexts. Recidivists are able to connect different parts of networks and function as brokers. In other words, they represent the backbone of criminal networks, sustaining organized crime across time and space. In this sense, the recidivism rate plays an important role in the evolution, structure and dynamics of corruption networks.
From a practical perspective, our model may have important implications for law enforcement and intelligence activities. In a scenario where we are able to estimate the number of recidivists, we could therefore approximate relevant features regarding the evolution and structure of the underlying network. Moreover, our model can even be used as a benchmark for related corruption network investigations, such as link prediction or efficiency in network dismantling.
Main references: